Why Spring Allergies Can Make Breathing Harder
Why Spring Allergies Can Make Breathing Harder For many people in the Northern Hemisphere, spring is a welcome change. The days get longer, the weather
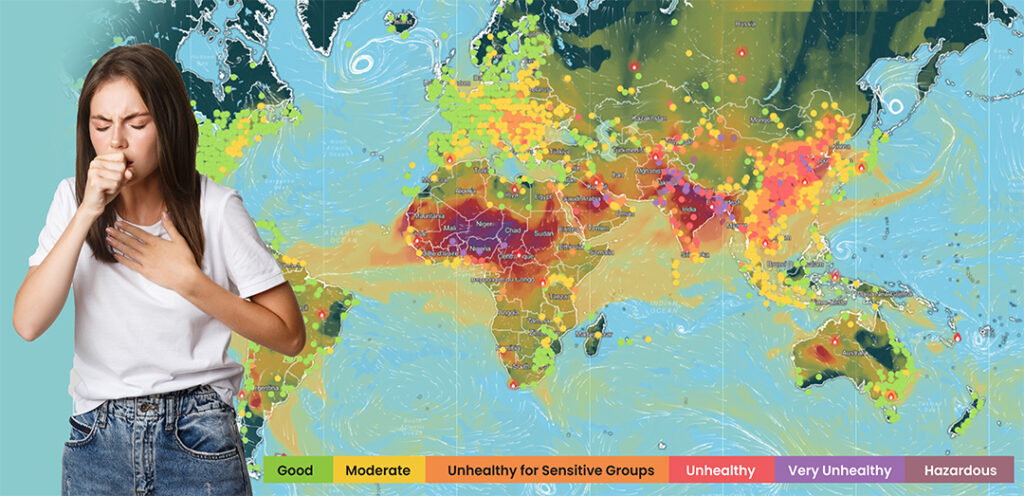
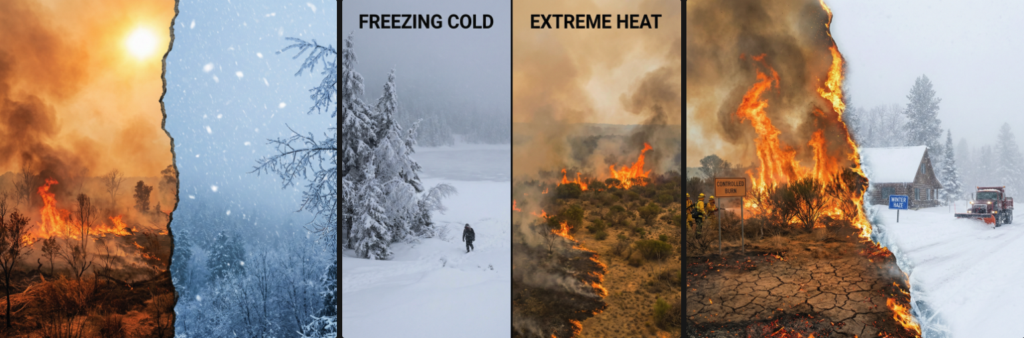
Around the globe we’re experiencing unusual environmental conditions from
1. Extreme heat to freezing cold,
2. Snowstorms to bush/wildfires, burn offs and winter haze.
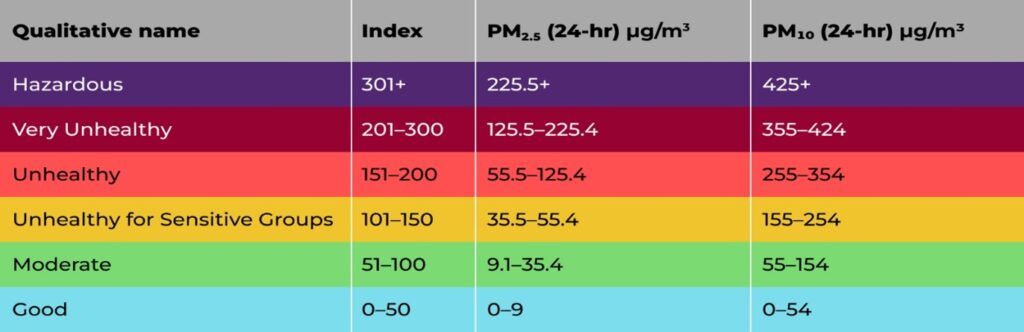
Following are a few common causes of Air Quality Index (AQI) spike patterns:
Wintertime Air Quality Index (AQI) Spikes
1.Wintertime Cold Air Trapping
2. Stagnant Weather
3. Mountainous Areas
4. Seasonal burning/heating/cooking
1. Wintertime Cold Air Trapping
Ever notice how a freezing winter day can look hazy, but the moment it snows the air suddenly feels crisp?
When temperatures drop, cold, dense air can settle near the ground and form a “lid” (a temperature inversion or thermal layer). That lid sinks lower as it gets colder, trapping pollution—smoke, car exhaust, and fine particle matter—right where we breathe. The result is that familiar smoggy haze during cold snaps.
Snow, on the other hand, often arrives with shifting weather that can help clear the air, and the cleaner smell can be misleading—pollution may still be lingering close to the surface.
If the Air Quality Index (AQI) is high, breathing this concentrated pollution can irritate and inflame the lungs, worsening asthma and COPD and potentially causing medium to longer-term damage.
2. Stagnant Weather
In winter, wind is your best friend—it stirs and spreads pollution so it can dilute and, sometimes, break out from under the low “lid” of cold air. That lowers the concentration where we breathe.
When the weather turns still, pollution has nowhere to go. It hangs in place for much longer, building up day after day. The result: thicker haze, higher particle levels, and a higher AQI.
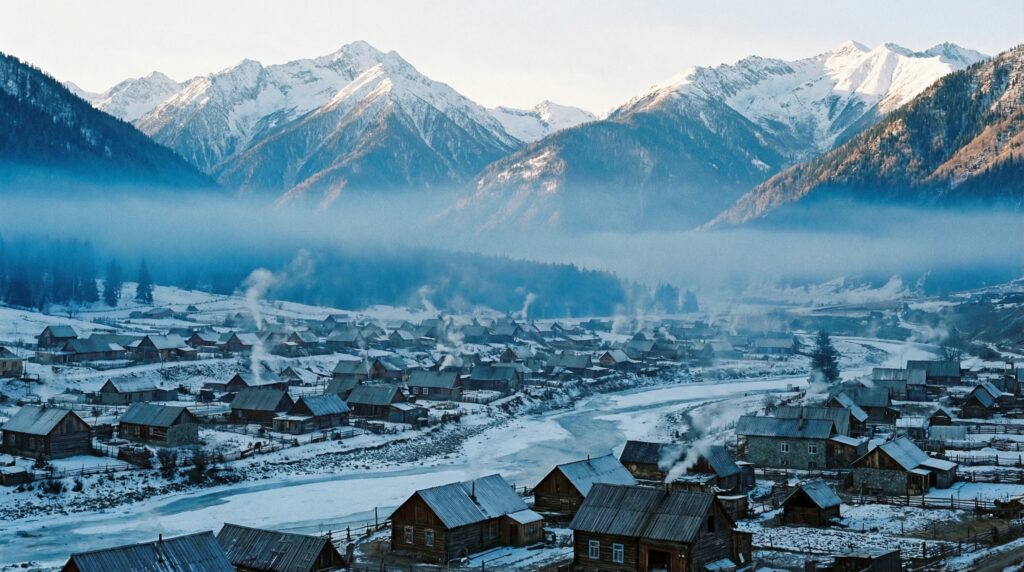
3. Mountainous Areas
In winter, valleys and mountainous regions can supercharge cold-air trapping. The surrounding peaks act like walls, helping a low “lid” of cold air settle in and stay put. That means smoke, car fumes, and fine particles can’t easily spread out or rise away—so they build up and become more concentrated.
Mountains can also block or weaken winds that would normally flush pollution out, letting haze linger for days during cold snaps.
4. Seasonal burning/heating/cooking
Beyond household fires for cooking and warmth, winter is also the “go-to” season for planned burns in many countries.
But burning crop waste—like stubble and leftover plant matter—adds a surge of smoke on top of everyday heating fumes. When that extra pollution gets trapped by cold-air “lids,” mountains, and stagnant weather, air quality can spike fast—sometimes pushing AQI from merely unhealthy into truly hazardous territory.
Examples of winter “Hazardous” AQI spikes (last 6 months)
Here are a few real-world snapshots of how bad winter air can get when smoke, cold-air trapping, mountains, and still weather collide:
Lahore, Pakistan — AQI 533 (Hazardous) — 16 Nov 2025
Delhi, India — AQI 530 (Hazardous) — 28 Dec 2025
Sarajevo, Bosnia & Herzegovina — AQI 302 (Hazardous) — 16 Dec 2025
Cairo, Egypt — AQI 429 (Hazardous) — 12 Jan 2026
Kuwait City, Kuwait — AQI 308 (Hazardous) — 22 Nov 2025
These are the kinds of conditions where the air doesn’t just look dirty—it can become genuinely dangerous to breathe.
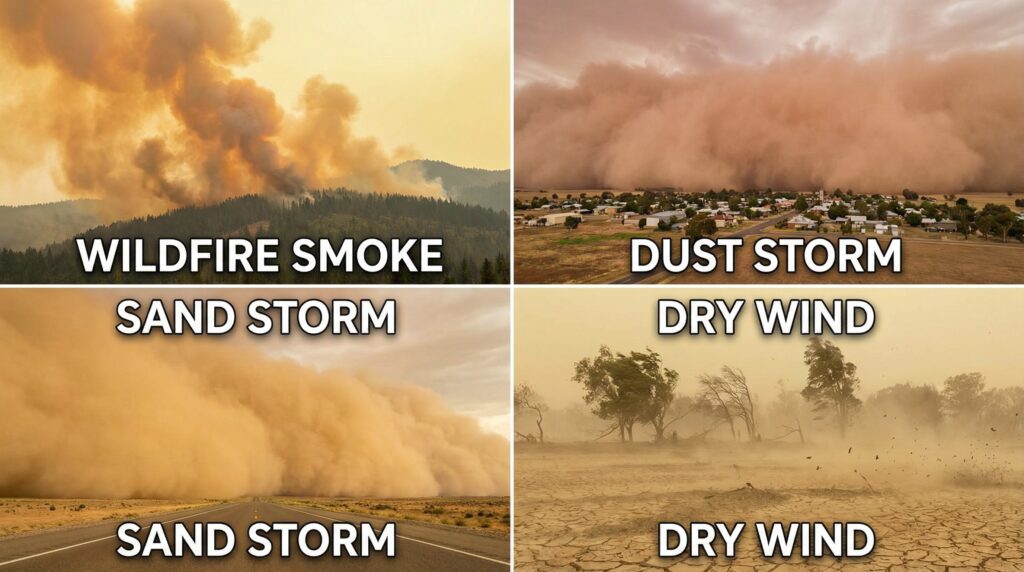
1. Wildfire/Bushfire Smoke
Bushfires and wildfires are most common in summer, but they can strike in winter too—and when they do, smoke can travel a long way.
Wildfire smoke is a complex cocktail of thousands of compounds, including fine particles and toxic gases. That haze isn’t just unpleasant—it can seriously affect health, putting anyone nearby or downwind (including pets) at risk.
Two examples of extreme wildfire/bushfire smoke (Hazardous AQI)
Victoria bushfires — PM₂.₅ > 500 μg/m³ (≈ AQI > 500, Hazardous) — 12 Jan 2026
Los Angeles bushfires — PM₂.₅ > 300 μg/m³ (≈ AQI > 300, Hazardous) — 7 Jan 2025
2. Dust/Sand Storms
Dust and sandstorms don’t just make the air look dirty—they flood it with fine particles that can be very hard (and risky) to breathe.
These particles can overwhelm the lungs’ natural “self-cleaning system,” the mucociliary escalator, which normally traps debris in mucus and sweeps it out. When too much dust is inhaled, the mucus can become thicker and stickier, slowing that clean up process and irritating the airways—leaving you feeling clogged, wheezy, and coughing as your body tries to clear it all out.
Two examples of extreme Dust/Sand Storms (Hazardous AQI)
Southern New Mexico — 18–19 Mar 2025: Dust storms were severe enough that reporting cited AQI values spiking to ≈1,000+ in/around the core of the storm (the article notes this is “well above” hazardous conditions).
Dubai — 4–5 Nov 2025: Reported AQI above 200 with pollution dominated by particulates during a regional dust + emissions episode.
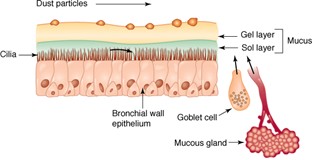
Your airways have a built-in “self-cleaning” system—called the mucociliary escalator.
Mucus acts like sticky tape, trapping dust, smoke, and other particles.
Cilia (tiny hair-like brushes) beat in rhythm to move that mucus up and out—like an escalator—so it can be swallowed or coughed out naturally.
Coarser particles (PM10) are more likely to get filtered and deposited in the nose/throat (“head” region) and larger conducting airways, where mucus + cilia can carry them out. One dosimetry model found PM10 deposits mainly in the head (55–95%) and tracheobronchial airways (3–44%).
In healthy lungs, this escalator can move mucus from the smaller airways toward the throat, helping clear the airway lining in less than ~24 hours (time varies).
PM₂.₅ can reach deeper parts of the lung—including regions where the mucociliary escalator doesn’t operate (the alveoli rely more on immune cells like macrophages).
And when PM₂.₅ is high, it doesn’t just “get past” the system—it can impair it by:
a) Irritating and injuring the airway surface (often via oxidative stress)
b) Changing mucus (making it harder to move)
c) Damaging or disrupting cilia function, especially with higher/prolonged exposure
All of that can make “self-cleaning” less efficient—especially on bad-air days.
In airway-clearance research using coarse (~4 µm) particles, about half were cleared quickly in healthy lungs (fast-phase half-time ~3 hours). When cilia function was impaired, the fast phase slowed (half-time ~17 hours), and the remainder cleared much more slowly (slow-phase half-time ~121 days).
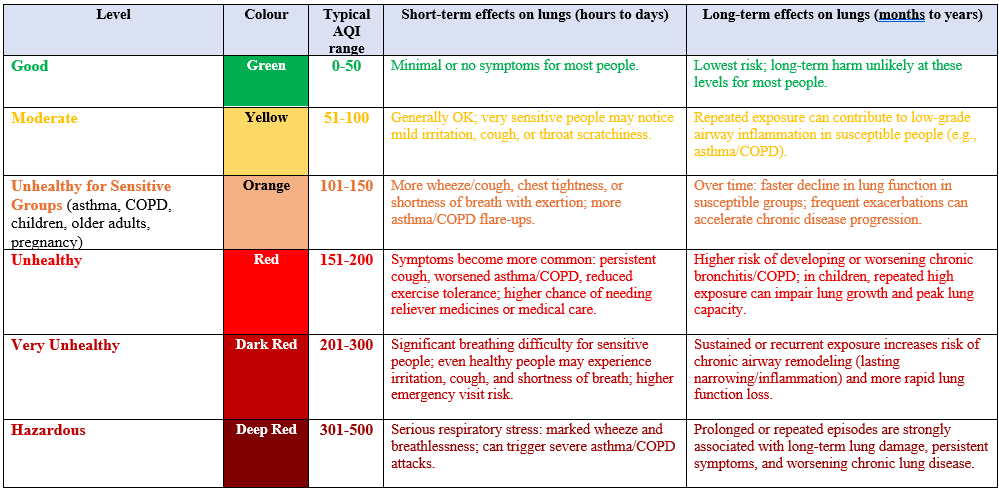
PM exposure is consistently linked to higher risk of both respiratory and cardiovascular disease, listing conditions associated with long-term exposure including:
It also notes that short spikes can worsen symptoms and may contribute to airway irritation and reduced exercise tolerance (and more).
For example, in the “Unhealthy” range it notes more common symptoms such as persistent cough, worsened asthma/COPD, reduced exercise tolerance (i.e. breathlessness from heavy exertion like walking up stairs, hills and running), and higher chance of needing medication or medical care.
Practical Steps to Help Reduce Risk on High-AQI days
Check
Reduce exposure
Clean the indoor air
If you must go outside
If you have an existing condition
Where AirPhysio fits on High-AQI days
AirPhysio is designed to support your airways’ natural “self-cleaning” system (the mucociliary escalator).
By combining expiratory resistance with oscillations, it may help:
Why that matters during smoke/haze/pollution
Mucus can trap inhaled particles. Helping your body clear mucus more effectively may help reduce airway retention of particles that are caught in that mucus—alongside exposure-reduction steps.
Important limitation
As an adjunct to exposure-reduction steps, AirPhysio may help mobilise and clear excess mucus from the larger (conducting) airways. Because airway mucus can trap inhaled particles and irritants, improving mucus clearance may help remove some trapped material from those airways—but it doesn’t prevent inhalation or deep-lung deposition of fine/ultrafine particles.
Practical positioning
If you’re exposed to smoke, haze, or pollution regularly, AirPhysio may be a useful addition to your high-AQI day toolkit—alongside checking AQI, reducing exposure, and keeping indoor air clean.
Medical note
If you have asthma/COPD/heart disease, follow your clinician’s action plan and seek care if symptoms worsen.
References
Health Effects Institute. (2022). State of Global Air 2022. Boston, MA: HEI.
Institute for Health Metrics and Evaluation (IHME). Global Burden of Disease (GBD) Results (2019–2021 updates). Seattle, WA: IHME.
World Bank. (2020). The Cost of Air Pollution: Strengthening the Economic Case for Action. Washington, DC: World Bank.
World Health Organization (WHO). (2022). Ambient (Outdoor) Air Pollution. Geneva: WHO.
United States Environmental Protection Agency (US EPA). Particulate Matter (PM) Basics. US EPA website.
Houtmeyers, E., Gosselink, R., Gayan-Ramirez, G., & Decramer, M. (1999). Regulation of mucociliary clearance in health and disease. European Respiratory Journal, 13(5), 1177–1188.
Myers, T. (2007). Positive expiratory pressure and oscillating positive expiratory pressure therapies. Respiratory Care, 52(10), 1308–1327.
Pryor, J. A. (1999). Physiotherapy for airway clearance in adults. European Respiratory Journal, 14, 1418–1424.
Berend, N. (2016). Contribution of air pollution to COPD and small airway disease. Respirology, 21(2), 237–244.
Bowatte, G., Lodge, C. J., Knibbs, L. D., Lowe, A. J., Erbas, B., Perret, J. L., et al. (2017). The influence of childhood traffic-related air pollution exposure on asthma. Journal of Allergy and Clinical Immunology, 139(1), 122–129.
ScienceDirect, The Lancet Planetary Health Volume 9, Issue 3, March 2025, Pages e174-e185, National and provincial burden of disease attributable to fine particulate matter air pollution in China, 1990–2021: an analysis of data from the Global Burden of Disease Study 2021, Tanchun Yu MS a *, Yixuan Jiang PhD b *, Renjie Chen PhD b, Peng Yin PhD c, Huihuan Luo PhD b, Prof Maigeng Zhou PhD c, Prof Haidong Kan PhD b d, https://doi.org/10.1016/S2542-5196(25)00024-5,
Scheuch, G., Kohlhaufl, M., Moller, W., Brand, P., Meyer, T., Haussinger, K.,… Heyder, J. (2008). Particle clearance from the airways of subjects with bronchial hyperresponsiveness and with chronic obstructive pulmonary disease. Experimental Lung Research, 34, 531-549. doi:10.1080/01902140802341710
IQAir’s newsroom posts are spotlight snapshots on relevant days when European city was in top global rankings – i.e https://www.iqair.com/newsroom/december-16-2025-sarajevo-among-top-10-most-polluted-cities-in-the-world?
Earth ArXiv, Air quality impacts of the January 2025 Los Angeles wildfires: Insights from public data sources, https://eartharxiv.org/repository/view/8634/
Pakistan Today November 16, 2025, Lahore tops global pollution charts as AQI hits 533, toxic smog chokes City, https://www.pakistantoday.com.pk/2025/11/16/lahore-tops-global-pollution-charts-as-aqi-hits-533-toxic-smog-chokes-city/
Chief Health Officer’s Report on the 2019-20 Bushfires and Smoke – health impacts in the ACT https://www.act.gov.au/__data/assets/pdf_file/0006/2518872/Chief-Health-Officers-Report-on-2019-20-Bushfires.pdf
Particulate Matter (PM) levels and AQI, January 16,2024, https://atmotube.com/blog/particulate-matter-pm-levels-and-aqi
The Guardian, WHO slashes guideline limits on air pollution from fossil fuels, 22 Sep 2021, https://www.theguardian.com/environment/2021/sep/22/who-cuts-guideline-limits-on-air-pollution-from-fossil-fuels#:~:text=One%20of%20the%20most%20harmful,said%20Andrea%20Lee%2C%20of%20ClientEarth.
DISCLAIMER: This article is for general information only and is not medical advice. If you have a medical condition or worsening symptoms, speak with a qualified healthcare professional.
Why Spring Allergies Can Make Breathing Harder For many people in the Northern Hemisphere, spring is a welcome change. The days get longer, the weather
How Can Eating Something Cause an Asthma Attack? How Can Eating Something Cause an Asthma Attack? Many people ask the question “How can eating something
Energy and focus often feel like things we need to chase through caffeine, supplements, or motivation. But the real foundation of both is simpler and
| Cookie | Duration | Description |
|---|---|---|
| cookielawinfo-checkbox-analytics | 11 months | This cookie is set by GDPR Cookie Consent plugin. The cookie is used to store the user consent for the cookies in the category "Analytics". |
| cookielawinfo-checkbox-functional | 11 months | The cookie is set by GDPR cookie consent to record the user consent for the cookies in the category "Functional". |
| cookielawinfo-checkbox-necessary | 11 months | This cookie is set by GDPR Cookie Consent plugin. The cookies is used to store the user consent for the cookies in the category "Necessary". |
| cookielawinfo-checkbox-others | 11 months | This cookie is set by GDPR Cookie Consent plugin. The cookie is used to store the user consent for the cookies in the category "Other. |
| cookielawinfo-checkbox-performance | 11 months | This cookie is set by GDPR Cookie Consent plugin. The cookie is used to store the user consent for the cookies in the category "Performance". |
| viewed_cookie_policy | 11 months | The cookie is set by the GDPR Cookie Consent plugin and is used to store whether or not user has consented to the use of cookies. It does not store any personal data. |